See the report before you pay for it
This is a complete, real report — all five pages, nothing blurred and nothing removed. It came out of the same renderer and the same database as one you would buy.
This is the report for Loudoun County, Virginia — the most heavily built data-centre county in the United States. Every page below is the real thing, at full size. Yours is the same five pages about your own county.
- Every interconnection request on record where you live, and which ones died.
- Announced data-centre load against what the grid there has ever connected.
- The schools, the neighbouring counties, and the campuses closest to the address.
- A method page naming the source column behind every single figure.
- A date on every page, and a promise the document will never be edited under you.
Download the whole PDF 5 pages · 456 KB · no email needed
Get this for your address
Type the address you actually care about. We build the same report for its county and email you the PDF.
One-off. No subscription. If you would rather see what is near you first, the address checker is free.
One report, no card, no catch — the same five pages you just read. Everyone gets one.
Every page, nothing withheld
Page 1
Cover
Who it is for, which county, and the date every figure on the following pages was true. Nothing in it changes afterwards.
Page 2
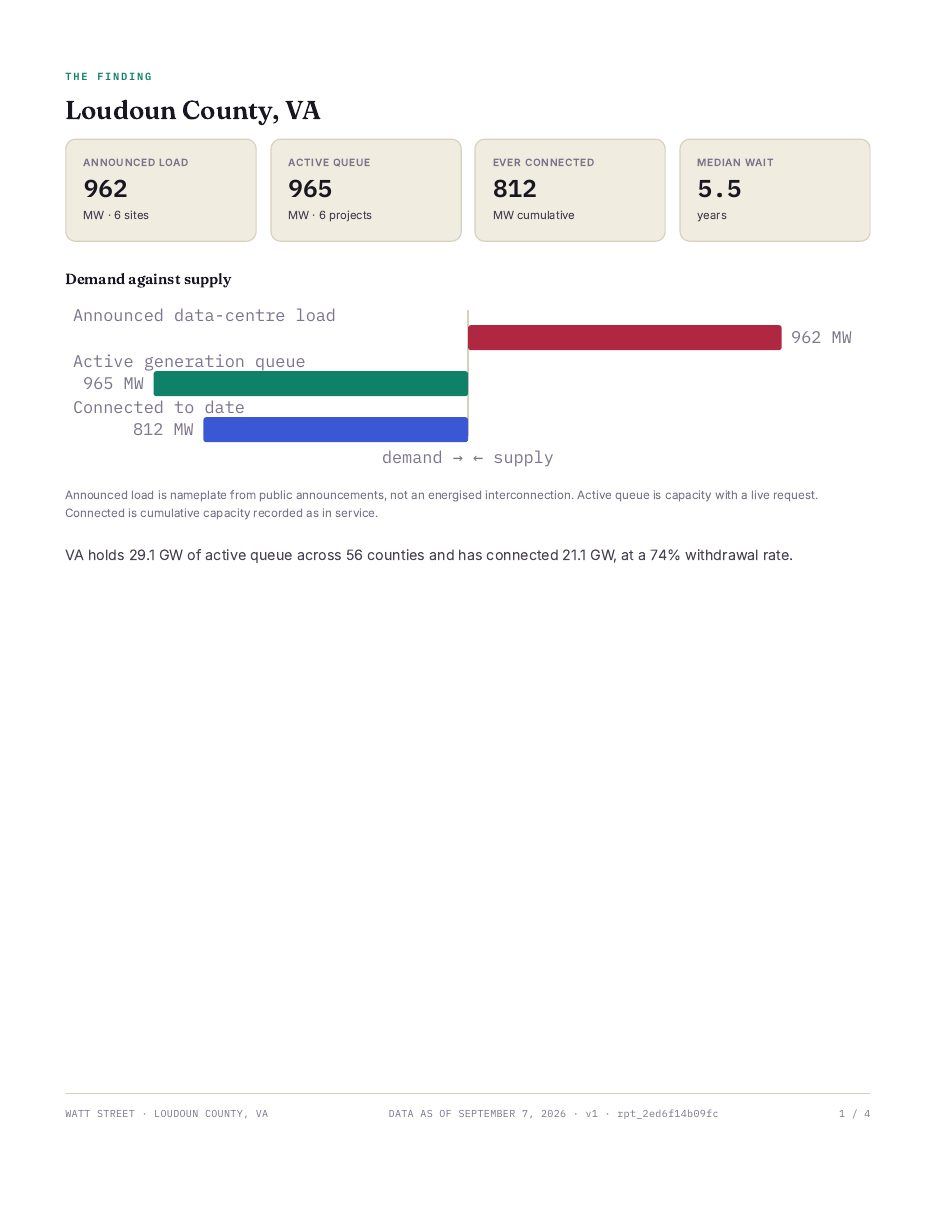
The finding
Announced data-centre load set against the generation queue and against what has actually been connected — the one comparison that tells you whether a county is promising more than it has ever built.
Page 3
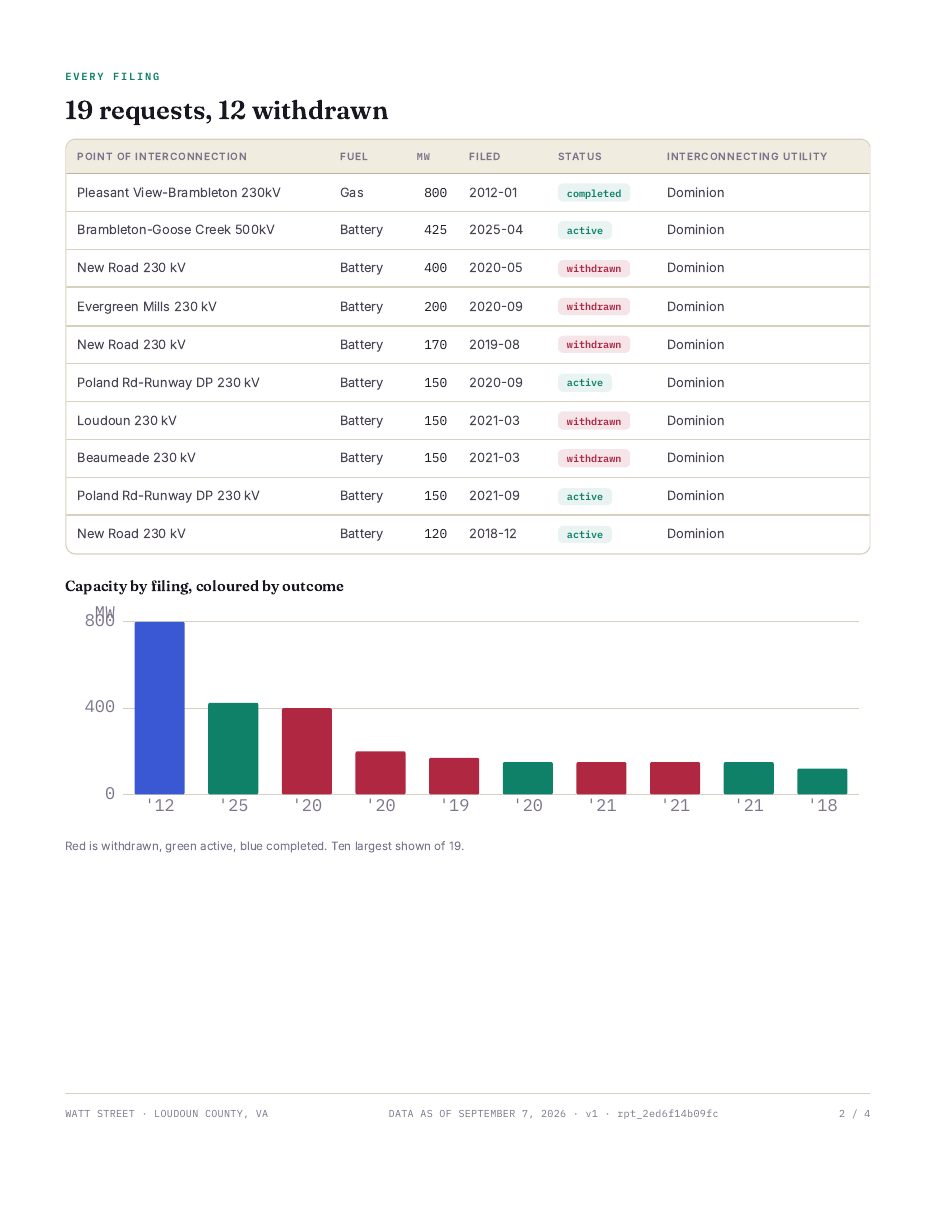
Every filing
Every interconnection request on record for the county: where it connects, what fuel, how many megawatts, when it was filed, and whether it is still alive.
Page 4
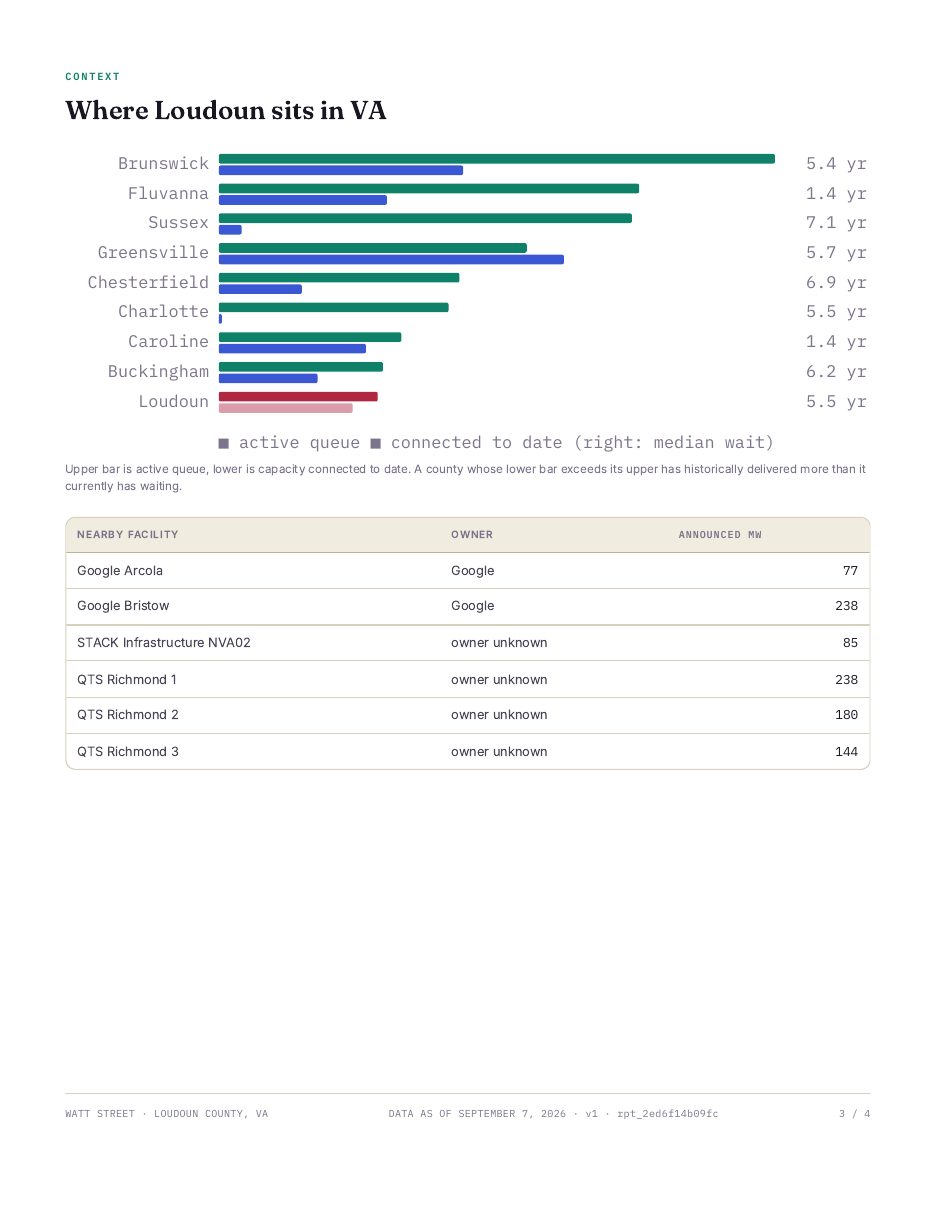
Context
The same county measured against its neighbours, and the data-centre campuses closest to it.
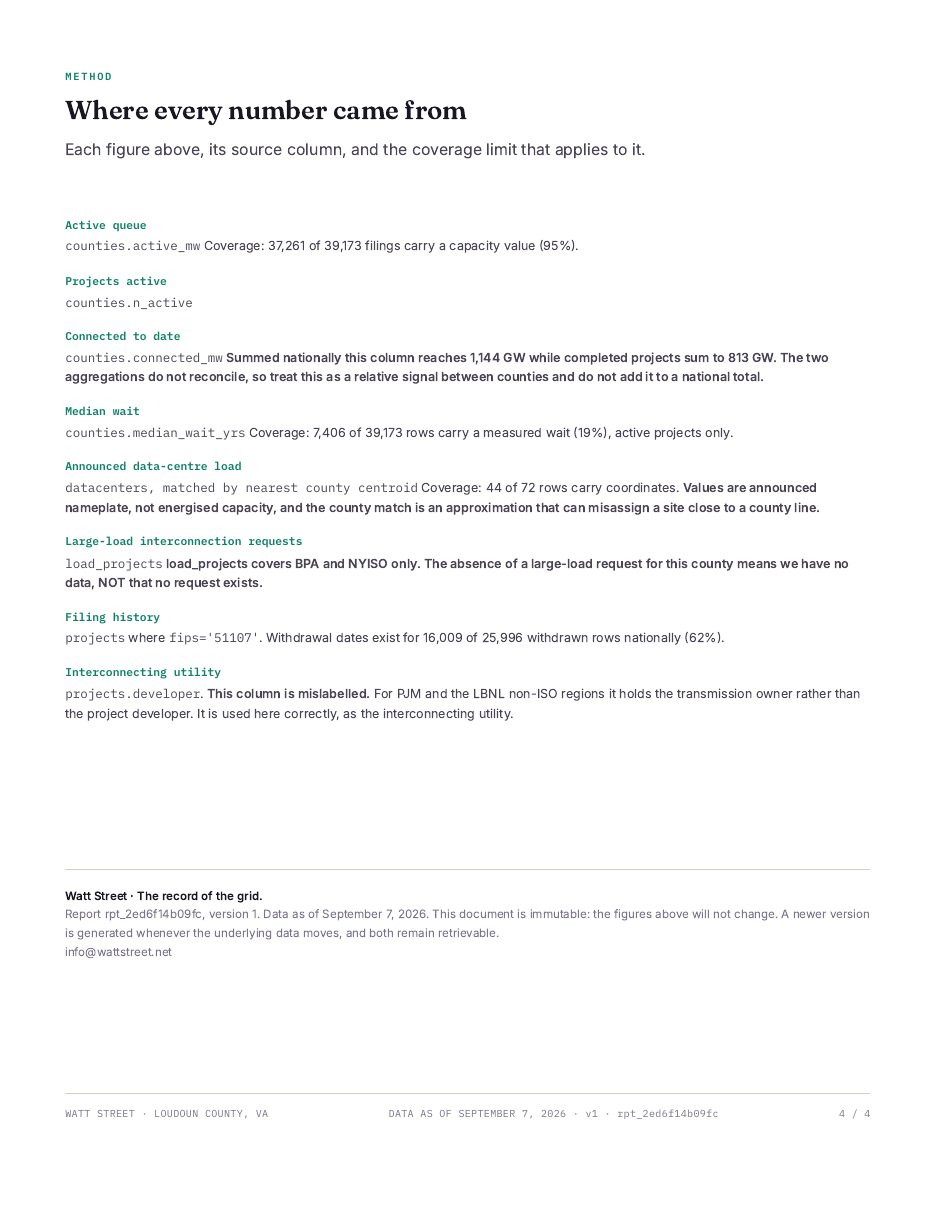
Page 5
Method
The column every number came from, and the coverage limit that applies to it. Where our data is thin, this page says so.
What this sample is and is not. It was generated on 2026-09-15 from the live database and says data as of 15 September 2026 on every page, because that is when the underlying filings were last ingested. A report you buy today carries whatever date is true on the day it is built. We do not backdate and we do not round.
Coverage is a floor, not a census: the method page in the sample lists, for each figure, how many rows actually carry that value. Counties with thin filing histories produce thinner reports, and the report says so rather than filling the gap.
Or start with the free one
One county report, free, no card. Pick any county in the country.